
Networks of smart buoys with underwater acoustic and environmental sensors, held together by graph neural networks. Built and field-tested on the Atlantic coast.




 Co-funded by the
Single-point monitoring misses what happens between the instruments. AquaScan treats the whole network as one system: the models learn on the graph itself, and the same models that detect events also predict them.
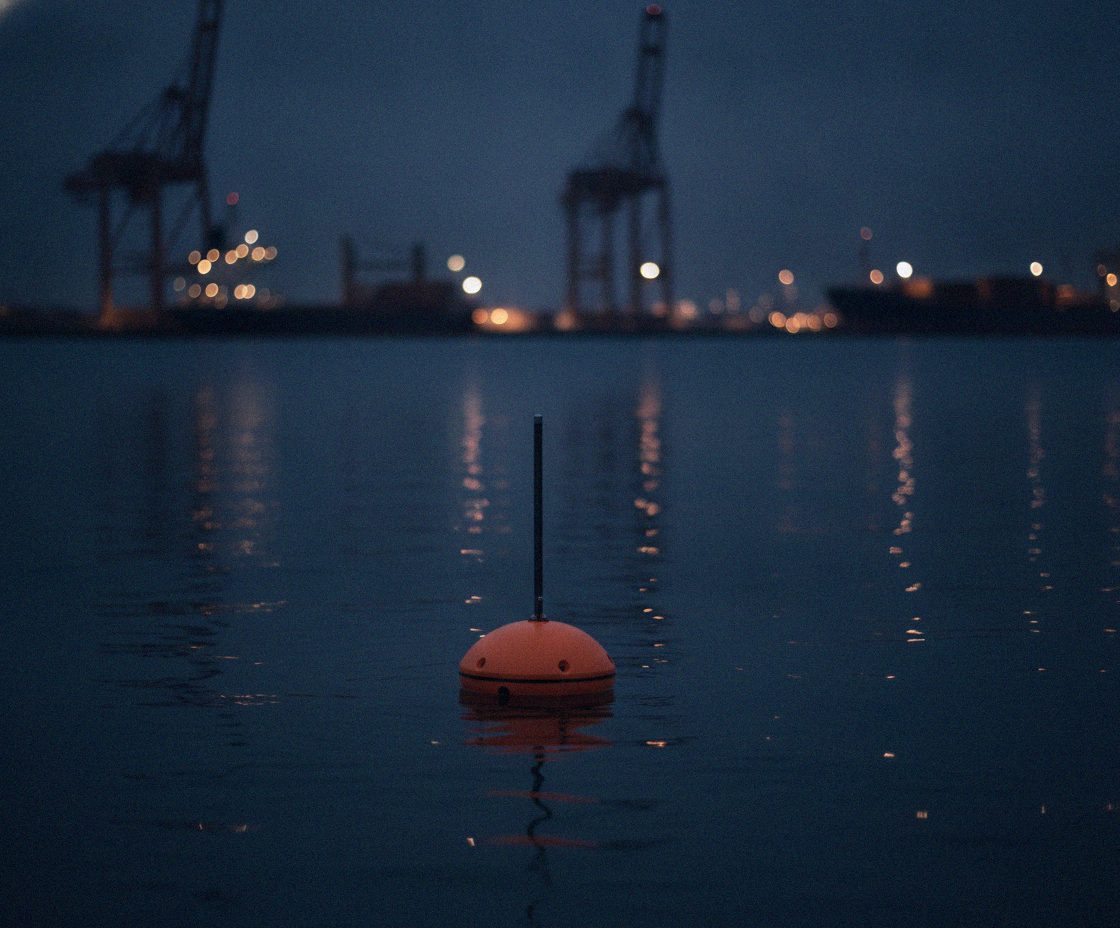
We launch a temporary network over your water body, record it at metre scale for weeks, and bring the nodes back in. What stays with you is the reliable, granular dataset that environmental studies and digital twins are built on. It is why port authorities trust us to bring them the data they need.
Monitoring today relies on a boat taking a few point samples a year. A buoy network measures the same descriptors continuously, mapped to your reporting obligations.
The first job of an AquaScan network is environmental impact analysis: the baseline and monitoring data that decisions about a coastline depend on.
Baseline and compliance monitoring for operations, dredging and construction.
Environmental monitoring alongside offshore infrastructure, the setting the research was designed for.
Water conditions and biodiversity indicators around farms and reserves, with longer-lived nodes for standing monitoring.
We run a small number of deployments per season: a compact cluster of nodes in your water for weeks, delivered as a continuous monitoring record with analysis. Next up: the Lima estuary, with APDL.
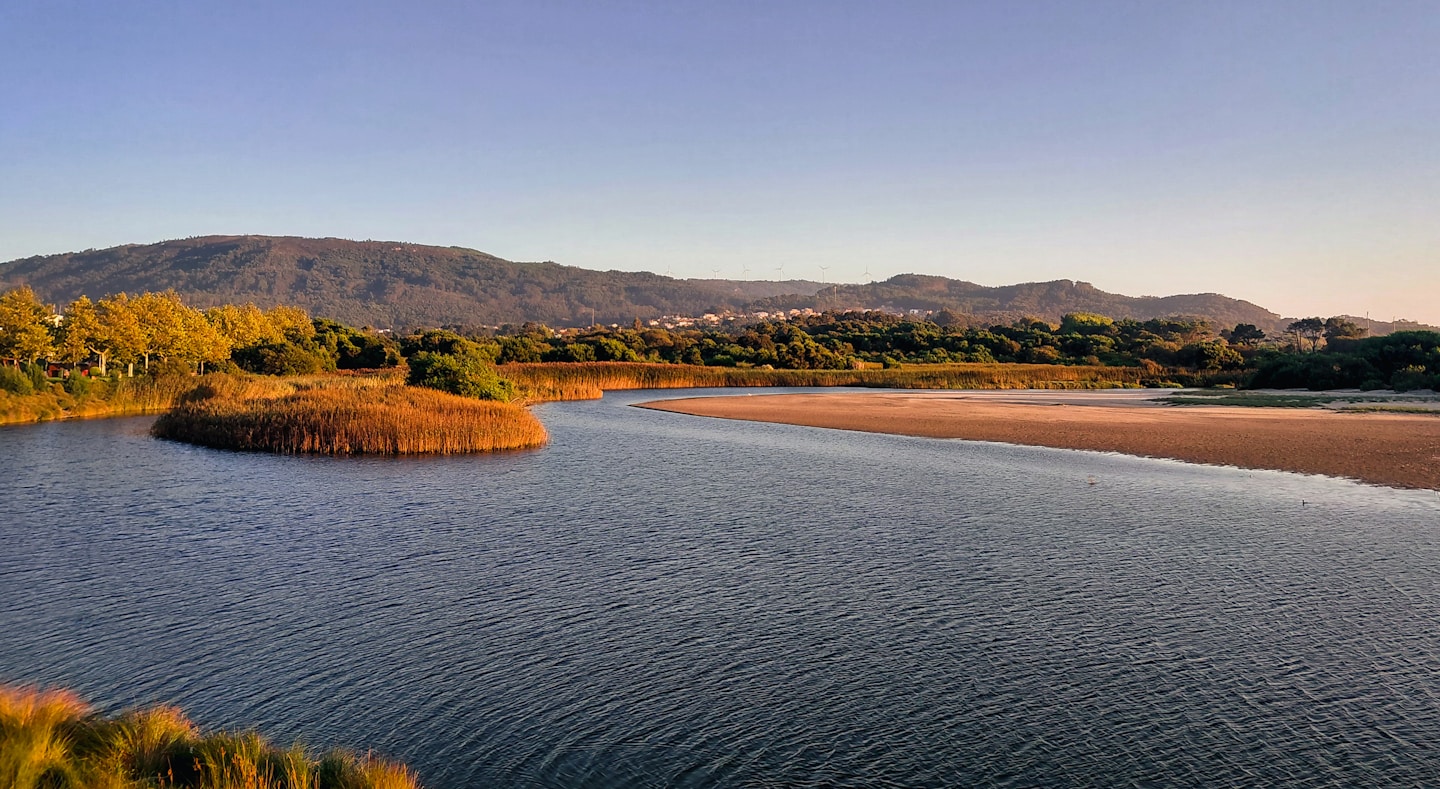
Ranked first in the SaferSEA Call for Pilots, opening the way to a pilot with APDL in the Lima estuary.
The science behind the network, on one of the leading ocean engineering stages.
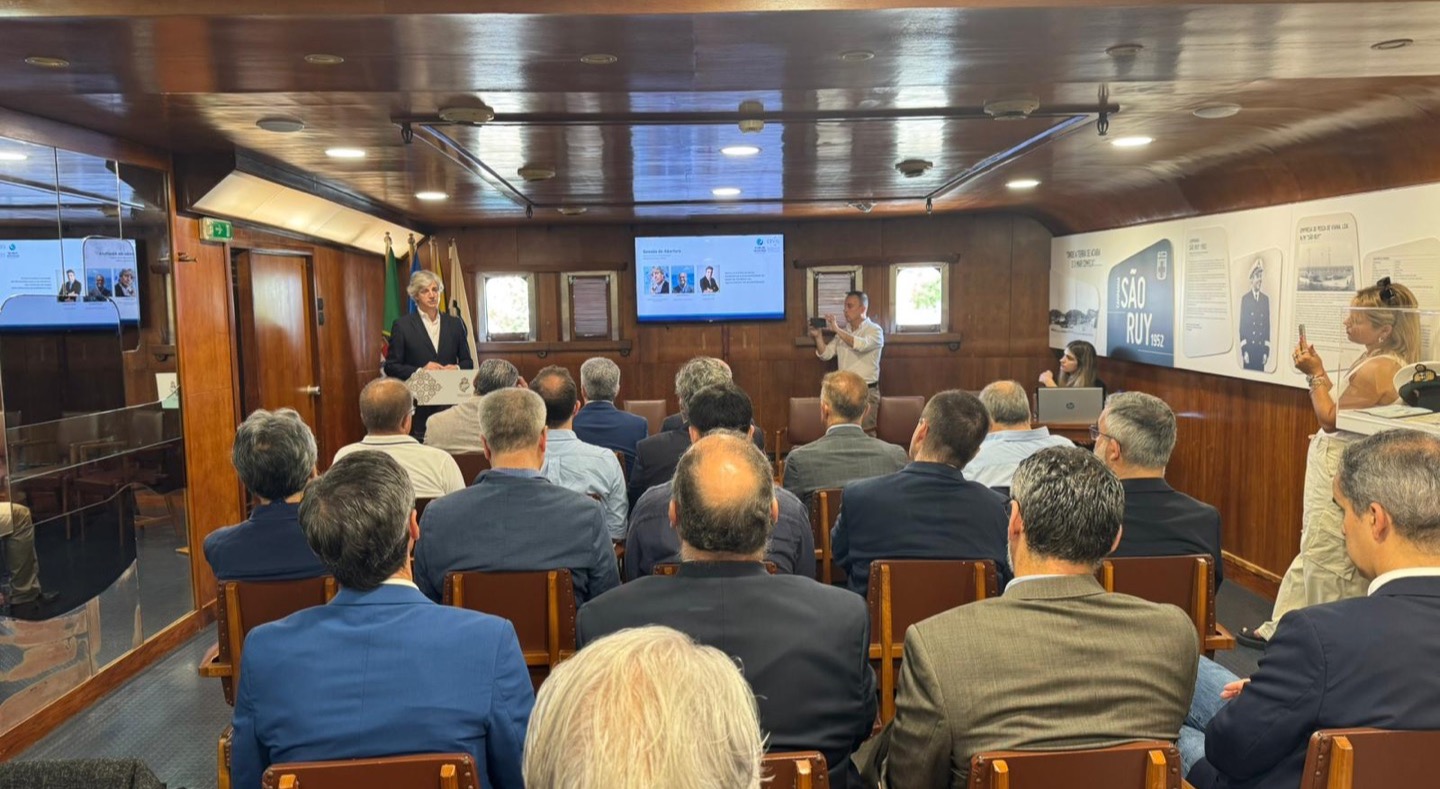
On the ocean-economy panel in Viana do Castelo, alongside the sector's main actors.
The nodes in the water taught us what the platform needs to be. Coverage comes from numbers and from the graph, not from a single expensive instrument.
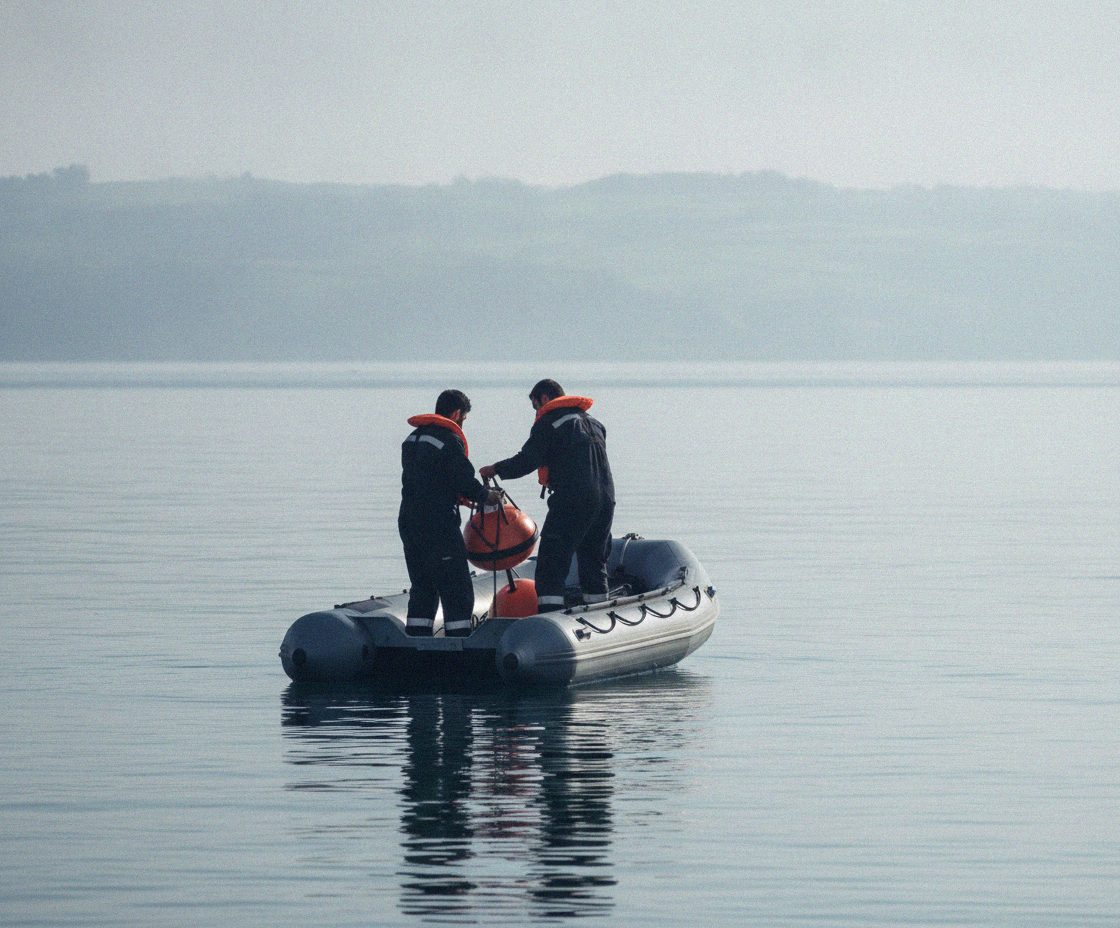
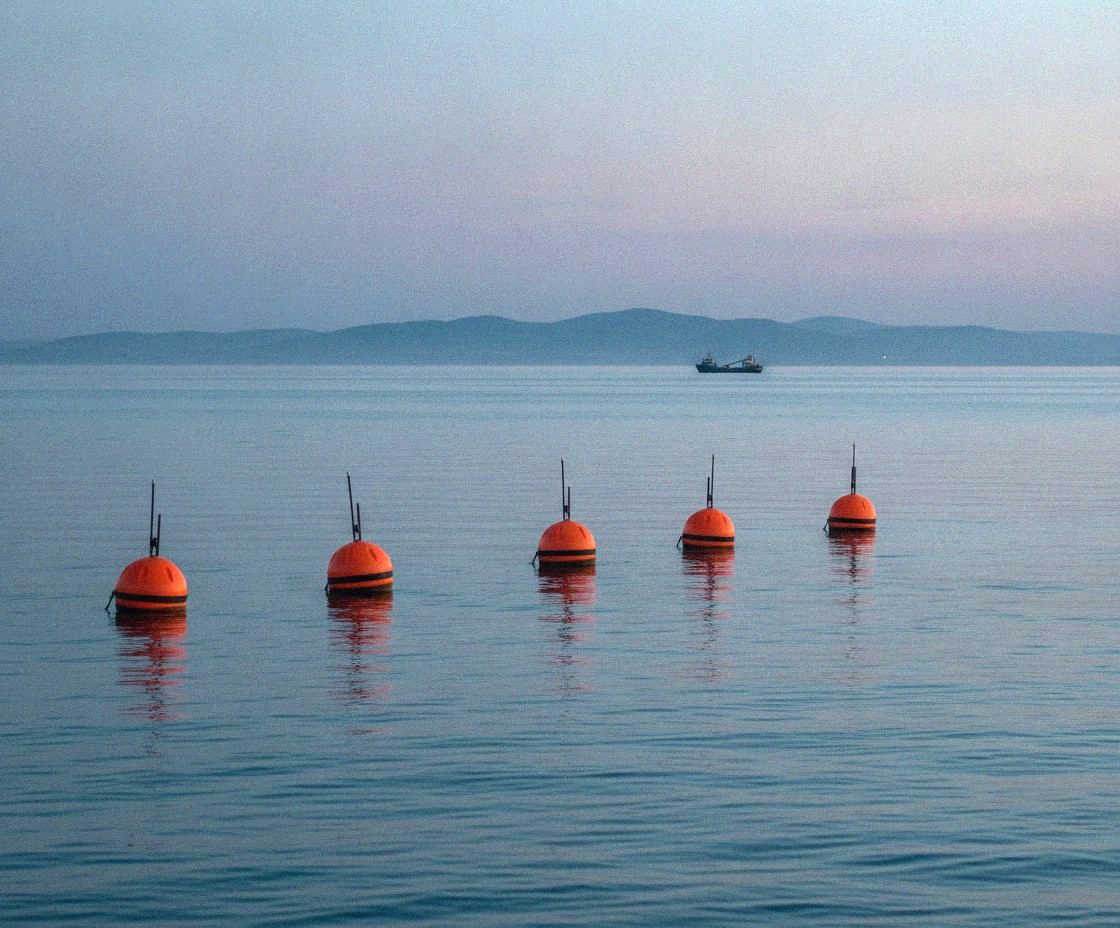
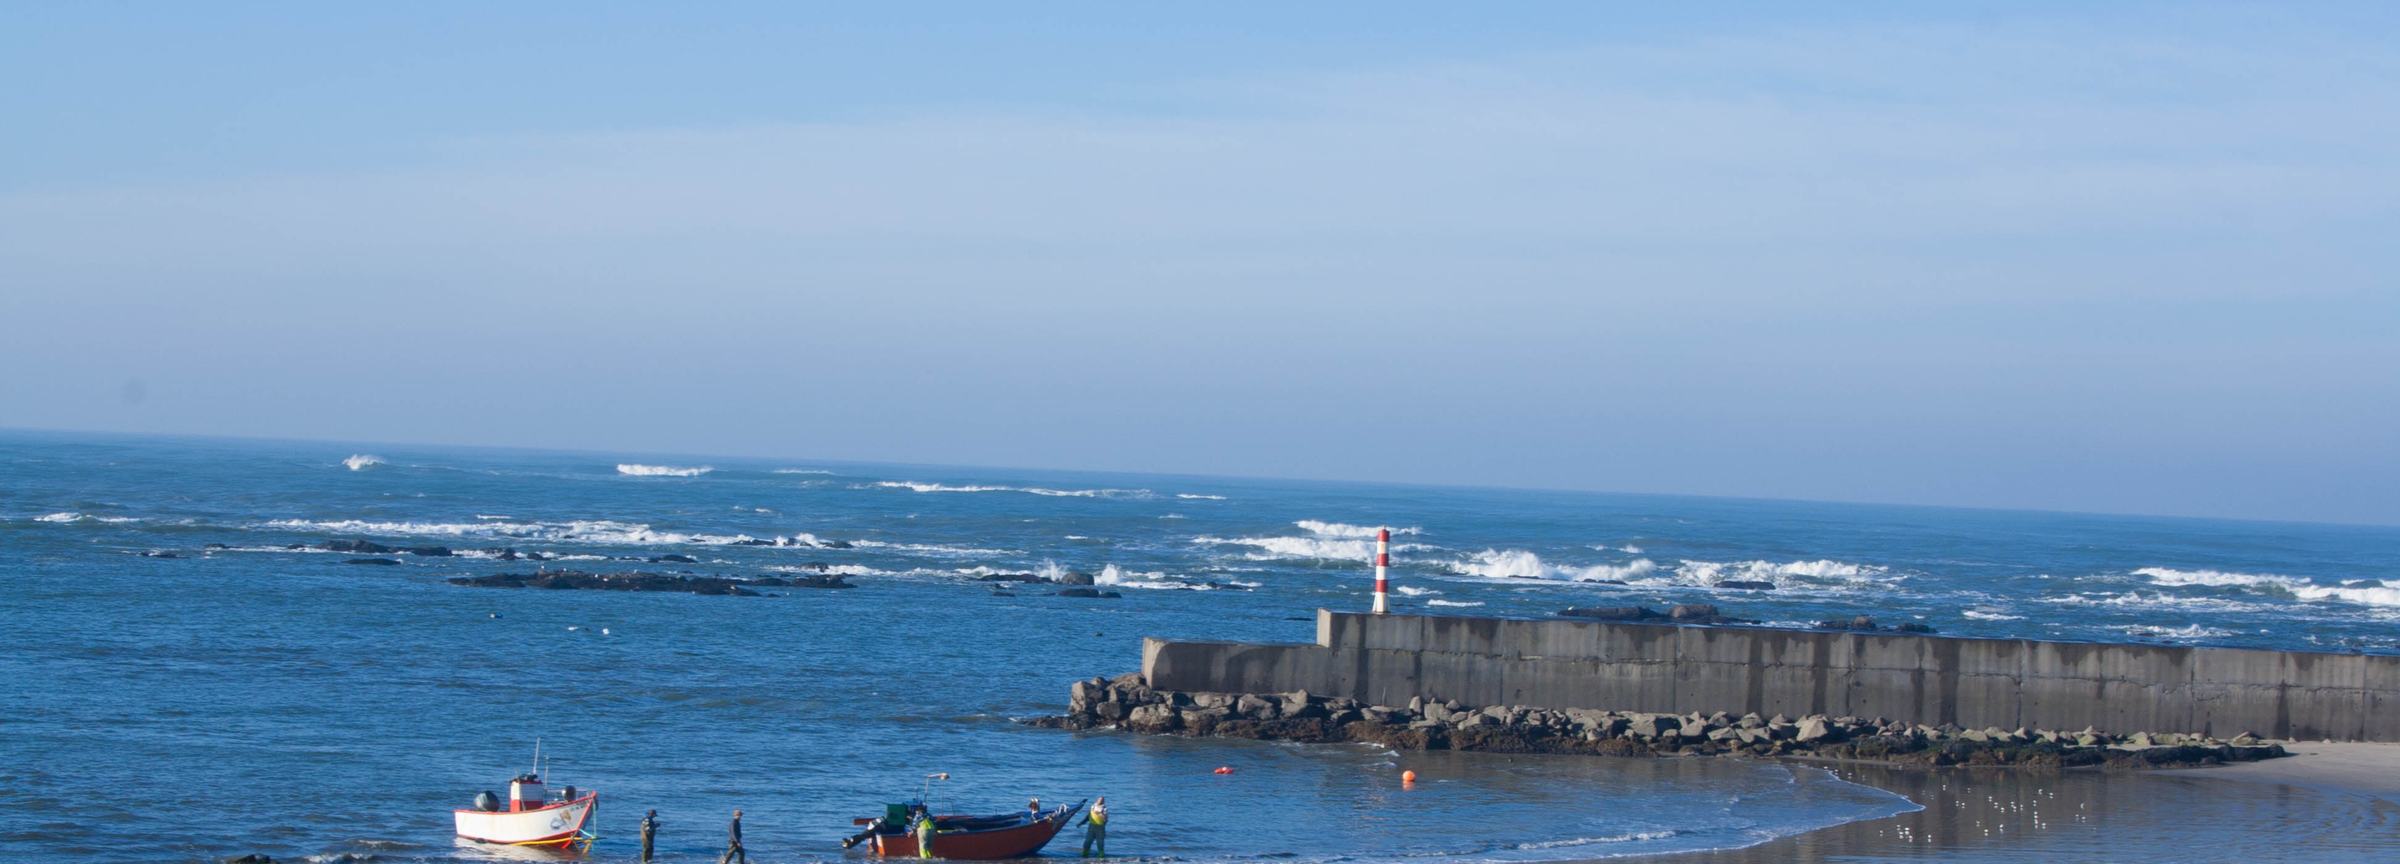
Built on the Atlantic coast, made to endure the ocean at its roughest.
It depends on the water body. Our smallest deployments start with a compact cluster of around six nodes and scale by adding more.
A continuous record of the descriptors you monitor: water quality, hydromorphology, noise and biodiversity indicators, delivered as data and analysis mapped to your reporting obligations.
You do. We operate the network and the models; the measurements from your site are yours.
Yes. The node is built for payload changes: salinity, dissolved oxygen, pH, chlorophyll and other sensors integrate per deployment.
Scoped per site. We look for partners: the goal is for both sides to win, not a procurement process.
For pilots, research or partnership enquiries, write to info@ctvc.pt.